Why the Trax Site Traffic Dashboard Stands Out
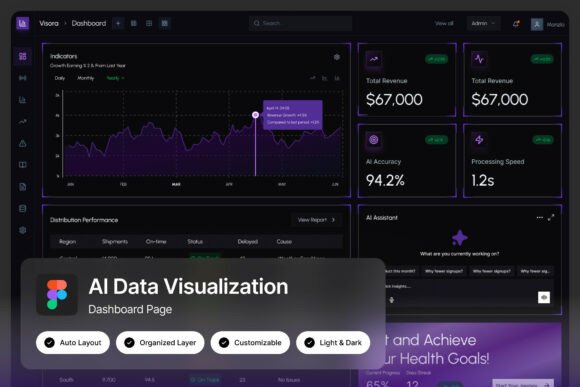
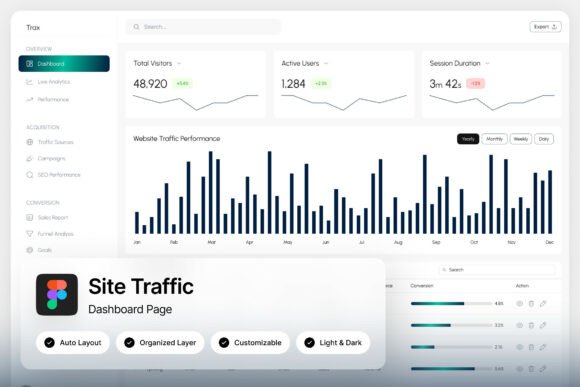
Every pixel serves a purpose. In the crowded field of web analytics, presenting complex data without overwhelming the user is the ultimate design challenge. The Trax Site Traffic Dashboard meets this challenge head-on, offering a clean, minimal UI that feels more like a premium magazine spread than a standard analytics tool. Designed specifically for web analysts, growth teams, and SaaS product designers, it strips away the noise to reveal what truly matters: visitor trends, session breakdowns, and engagement metrics.
Built for Clarity and Speed
Modern data dashboards often suffer from visual clutter. The Trax dashboard avoids this by establishing a strong visual hierarchy from the moment the screen loads. The light blue-and-white color palette creates a sense of openness and trust, while the generous whitespace gives each data point room to breathe. For those working in UI design and UX design, this layout is a masterclass in prioritization. The 1440×1024 px resolution is perfectly optimized for standard desktop workflows, ensuring that critical metrics like traffic sources and user engagement are immediately accessible without scrolling.
What You Get in the Asset Package
For designers looking to integrate high-fidelity prototypes into their design workflow, the included .fig file is a goldmine. The layers are well-organized, named, and grouped—allowing for rapid customization. Whether you need to align the dashboard with a specific brand identity or adjust the typography (free Google Fonts are included), the file structure makes it easy. The light and dark mode interfaces provide flexibility for different presentation contexts, a feature highly valued in modern web design and SaaS product development.
Practical Applications for Design Teams
How do you leverage a resource like this effectively? Here are a few core applications:
- Client Presentations: Use the high-resolution mockups to demonstrate how a custom analytics portal would look and feel. The professional presentation quality helps win stakeholder buy-in.
- Product Design Sprints: The customizable components allow product teams to rapidly prototype variations of a traffic monitoring tool, testing different visual design approaches without starting from scratch.
- Marketing and Sales Collateral: For digital marketing teams building SEO reporting tools, the visual assets create a compelling narrative around data transparency and performance tracking.
- Design Inspiration: Study the composition. The way the bar charts, session breakdowns, and traffic source summaries are laid out offers excellent design inspiration for any data-heavy interface.
Typography and Visual Hierarchy
One of the standout features is the use of typography to guide the eye. Headlines are distinct, body text is perfectly legible, and the data labels are designed for fast reading. This attention to detail is crucial for editorial design and web design, where text and imagery must work in harmony. By relying on a restrained color palette and clear iconography, the dashboard achieves a modern aesthetic that feels current and sophisticated.
Elevating Brand Identity Through Data Interfaces
Every touchpoint with a user contributes to their perception of a brand. A clunky or confusing analytics dashboard can erode trust, while a polished, intuitive one reinforces brand identity. The Trax dashboard demonstrates how graphic design principles can be applied to functional tools. The consistency of the UI elements, the smooth transitions between light and dark modes, and the pixel-perfect alignment all contribute to a professional presentation that reflects well on the company behind the tool.
For creative projects ranging from SaaS landing pages to internal reporting portals, having access to quality creative assets like this Figma file accelerates production timelines. It allows designers to focus on solving higher-level problems, such as user flow and data interpretation, rather than getting bogged down in the micro-details of button states and grid alignment.
The best design tools are invisible. They guide the user to the intended action or insight without calling attention to themselves. The Trax Site Traffic Dashboard serves as an excellent example of this philosophy in practice, making it a valuable addition to any designer or product team’s toolkit.
Ultimately, the strength of this resource lies in its adaptability. Whether you are crafting a brand-new analytics platform or refining an existing one, the principles embedded in this design—clarity, consistency, and user empathy—will help you create a product that users trust and enjoy using.