Spendly Media Spending Dashboard: Smarter Ad Budget Decisions
Tracking media spend across multiple channels often feels like trying to drink from a fire hose. Data pours in from every direction, and without a clear view, decisions get delayed, budgets drift, and performance suffers. Spendly Media Spending Dashboard offers a different approach. It consolidates complex campaign data into a single, visually coherent interface designed for speed. Whether you manage a small ad portfolio or oversee enterprise-level campaigns, this toolset aims to turn raw numbers into actionable insights.
What Makes This Dashboard Distinct
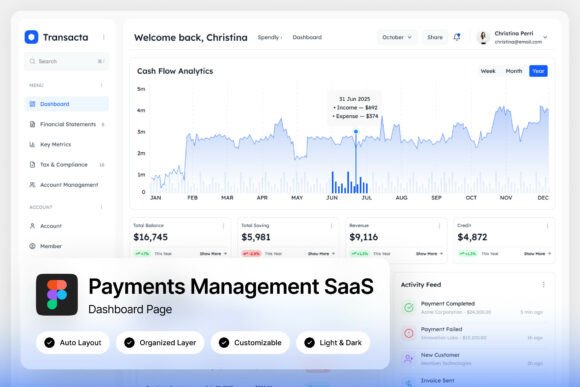
Spendly Media Spending Dashboard is built around a bold orange-and-white theme that prioritizes readability and contrast. Every element, from budget allocation charts to channel performance bars, is laid out at 1440×1024 px resolution. This is not a generic template. It is a purpose-built UI for media buying and advertising teams who need to scan spending patterns, compare channel ROI, and adjust allocations without digging through spreadsheets.
The design includes two high-quality admin screens that cover budget breakdowns, ad spend summaries, and ROI overviews. Because the layout is fully customizable in Figma, you can adapt it to your specific data sources, branding, and reporting cadence. The file comes with well-organized, named, and grouped layers, so editing is straightforward even if you are not a professional designer.
Channel Performance at a Glance
One of the most useful features is the channel performance bar section. Instead of jumping between platforms to assess whether Google Ads is outperforming LinkedIn or TikTok, you get a unified view. This matters when weekly or monthly budget reviews require quick rebalancing. For example, if a social channel suddenly shows a dip in efficiency, you can shift funds to a stronger performer within the same meeting. Spendly Media Spending Dashboard makes that kind of agility possible because the data is presented in a comparative format, not isolated numbers.
This is especially valuable for marketing agencies managing client portfolios. Presenting a clear, visual breakdown of spend versus return builds trust and reduces the number of back-and-forth questions. Clients want to see where their money went and what it delivered. The dashboard communicates that story without requiring a lengthy narrative.
Practical Benefits for Everyday Use
The real value of Spendly Media Spending Dashboard lies in how it simplifies decision-making. When you open the file, you get a pixel-perfect layout that is ready for both light and dark modes. This flexibility matters if your team works across different environments or if you present dashboards in varying lighting conditions. Dark mode can reduce eye strain during late-night reviews, while light mode may work better in client presentations.
Another practical advantage is the included free Google Fonts. Typography is often overlooked in dashboard design, but legible typefaces affect how quickly you can parse information. With fonts already linked and sourced, you eliminate the guesswork. The ZIP file also contains a help guide PDF and a font links text file, which means you can start editing almost immediately.
Who Benefits Most
Marketing agencies will appreciate the ability to create polished spend reports without hiring a designer every time. If you present monthly performance reviews to five different clients, you can duplicate the file, plug in new data, and maintain a consistent look.
Ad tech designers building internal tools or SaaS products will find the structure useful as a reference or starting point. The organized layers make it easy to extract specific components like budget allocation charts or ROI summaries and integrate them into larger systems.
SaaS teams developing campaign spend analytics tools can use this dashboard as a design prototype. Testing user flows, color contrast, and data density within a realistic layout saves development time. You can validate assumptions about what information users need most urgently before writing any code.
Where It Fits and Where to Compare
Spendly Media Spending Dashboard is not a live analytics tool. It is a design resource. If you need real-time data integration, you will need to connect it to your own data stack or use it as a visual specification for development. Similarly, the images shown in previews are for demonstration only and are not included in the download. That is standard for UI kits, but worth noting so expectations stay aligned.
For teams that already have a reporting system but lack a consistent visual language, this file reduces friction. Instead of building charts from scratch or using default spreadsheet colors, you have a polished foundation. For those who prefer lighter-weight tools, a standalone spreadsheet may still suffice. But when presentation quality and speed of comprehension matter, a dedicated dashboard UI often outperforms generic alternatives.
How It Supports Creativity and Efficiency
Designing a dashboard from scratch involves hundreds of micro-decisions: spacing, color hierarchy, label placement, chart type selection. Spendly Media Spending Dashboard removes that burden. With the pixel-perfect layout and grouped layers, you can focus on the data story rather than the visual mechanics. If you are a freelancer or small business owner tracking your own ad spend, this means you can produce professional-looking reports in a fraction of the time.
The dual-mode interface also opens creative possibilities. You can present the same data set in light mode for a formal board meeting and switch to dark mode for internal team reviews. This adaptability supports different communication contexts without requiring separate files.
Strengthening Communication with Stakeholders
Numbers alone rarely persuade. Visual context does. When you show an ROI summary alongside spending bars on the same screen, patterns emerge. A stakeholder might notice that a low-spend channel is outperforming a high-spend one. That observation leads to questions, which leads to better allocation decisions. Spendly Media Spending Dashboard is designed to surface those patterns quickly.
For educators teaching media buying or digital marketing, this UI kit can serve as a teaching tool. Students can practice interpreting spend data in a realistic layout rather than abstract tables. That hands-on familiarity prepares them for real-world reporting scenarios.
Final Thoughts on Fit and Value
Spendly Media Spending Dashboard delivers what it promises: a bold, data-rich UI for media spending analysis. The orange-and-white theme is distinctive without being distracting. The resolution and layout are tailored for admin screens used in fast-paced environments. If your work involves monitoring campaign budgets, presenting spend reports, or designing analytics tools, this resource can save time and improve clarity.
Consider your own workflow. Do you spend more time formatting data than analyzing it? Do your reports communicate clearly at a glance? If the answer is yes to either, exploring a purpose-built dashboard like this one is a practical step. It is not a magic solution, but it is a solid foundation for making smarter media spending decisions every day.