Buildify Management Dashboard: A Complete Guide to Construction Project Oversight
In the fast-evolving world of construction technology, the ability to manage complex workflows, track budgets, and coordinate teams from a single interface has become essential. The Buildify Management Dashboard is a purpose-built SaaS dashboard UI designed to meet these exact needs. Whether you are a prop-tech startup, a field operations designer, or a site management team, understanding what Buildify offers and how it fits into modern construction management can transform how you approach project oversight. This article walks you through everything from its core features to its practical relevance, common misconceptions, and why it matters in today's digital construction landscape.
What Is the Buildify Management Dashboard?
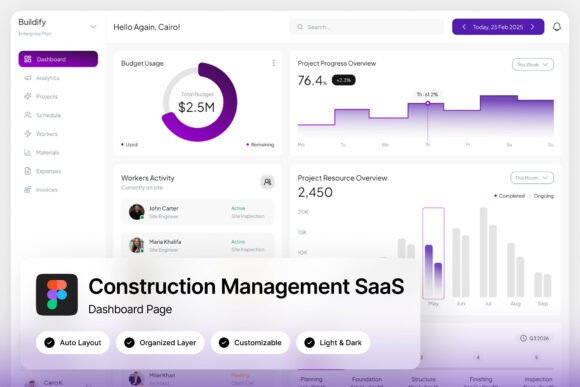
At its core, the Buildify Management Dashboard is a clean, structured construction management SaaS dashboard UI. It provides a visual command center for managing construction projects through a light purple-and-white theme that balances professionalism with readability. Unlike generic project management tools, Buildify is specifically crafted for construction workflows, including project progress trackers, task assignments, budget overviews, and workforce metrics.
The layout is organized and intuitive, enabling users to quickly grasp the status of multiple construction sites, resource allocations, and team performance. It is built to be fully customizable, with pixel-perfect layers and well-named groups in Figma, making it an ideal starting point for teams designing site management platforms.
Who Is Buildify For?
Buildify is designed for a broad but specialized audience:
- PropTech and ConTech startups looking for a ready-to-use dashboard UI to showcase or develop their own platforms.
- Field operations designers who need to visualize on-site progress, assignments, and budgets in a way that field teams can understand at a glance.
- SaaS teams building project or site management platforms, especially those targeting the construction industry.
- UX/UI designers who require a well-organized Figma file with named layers, grouped components, and light/dark mode support.
Key Features of the Buildify Management Dashboard
Understanding the specific features of Buildify helps you see why it stands out from generic dashboard templates. Below is a breakdown of its most important capabilities.
Project Progress Trackers
One of the most critical elements in construction management is knowing where each project stands. Buildify includes visual progress indicators that show completion percentages, milestone statuses, and upcoming deadlines. These trackers are designed to be instantly readable, helping project managers and stakeholders avoid time-consuming report digging.
Task Assignment and Workflow Management
Every construction project involves dozens, if not hundreds, of tasks. Buildify organizes task assignments in a way that clarifies who is responsible for what, when tasks are due, and which ones are overdue. The interface supports quick updates and re-assignments, reducing communication friction among field and office teams.
Budget Overviews
Budget overruns are a common pain point in construction. Buildify addresses this with clear budget overviews that compare planned spending against actual expenses. Color-coded indicators help teams spot potential issues before they escalate, supporting proactive financial management.
Workforce Metrics
Understanding workforce availability, productivity, and distribution across sites is essential. Buildify provides workforce metrics that display team size, hours logged, and task completion rates. This data enables managers to allocate resources more effectively and identify bottlenecks.
Light and Dark Mode
The dashboard comes with both light and dark mode interfaces, allowing users to switch based on preference or lighting conditions. This is particularly useful for field teams who may use the dashboard on-site in varying environments.
High-Quality Screen Resolution
The dashboard is designed at 1440×1024 px resolution, making it suitable for standard desktop monitors and laptop screens. The pixel-perfect layout ensures that every element looks crisp and professional.
What You Get in the Buildify Package
When you download Buildify, you receive a ZIP file containing everything needed to start customizing the dashboard:
- Figma file (.fig) – Editable, well-organized, and ready for customization.
- Help Guide (.pdf) – Step-by-step instructions to get started quickly.
- Font Links (.txt) – Links to free Google Fonts used in the design, so you never have licensing worries.
Note: The images shown in previews are for demonstration only and are not included with the download. This keeps the file lightweight and focused on the UI components you actually need.
Why Buildify Matters in Modern Construction Management
Construction projects are notoriously complex, involving multiple stakeholders, tight budgets, and ever-changing timelines. Traditional tools like spreadsheets or generic project management software often fall short because they are not built for the specific demands of construction workflows.
Buildify addresses this gap by providing a specialized interface that aligns with how construction teams actually work. It brings together progress, people, and budgets in a single view, reducing the need to switch between different tools. For prop-tech and con-tech startups, this kind of dashboard can serve as the foundation for a full-fledged platform, accelerating development cycles and improving investor pitches.
Practical Relevance for Field Operations
Field operations designers and site managers benefit from Buildify's clarity. Instead of digging through emails or paper reports, they can see at a glance how each site is performing. Task assignments become transparent, and budget deviations are highlighted early. This supports faster decision-making and fewer costly mistakes.
Common Misunderstandings About Dashboard UIs in Construction
Despite the growing adoption of construction technology, several misconceptions persist about dashboard UIs like Buildify.
Myth 1: Dashboard UIs Are Only for Office Teams
Many assume that dashboards are only useful for executives or office-based project managers. In reality, Buildify's intuitive design makes it accessible to field teams too. With progress trackers and task lists, site supervisors can use it daily to coordinate work.
Myth 2: Customizable Dashboards Require Coding Skills
Because Buildify is delivered as a Figma file with well-named layers and groups, anyone with basic Figma knowledge can customize it. You do not need to be a developer to adjust colors, rearrange components, or add new elements.
Myth 3: Construction Dashboards Are Too Generic
Generic project dashboards often ignore construction-specific metrics like workforce allocation, material tracking, and site-level progress. Buildify is purpose-built for these needs, making it far more relevant than a one-size-fits-all tool.
How Buildify Fits into the PropTech and ConTech Ecosystem
The construction technology sector is growing rapidly. Startups in this space need tools that demonstrate their understanding of real-world construction challenges. Buildify provides a ready-made UI framework that can be adapted to specific products, whether you are building a site management platform, a field operations tool, or a project oversight solution.
For SaaS teams, having a well-organized Figma file with pixel-perfect layers reduces design time and ensures consistency. The included light and dark modes also allow you to offer users flexibility without additional design work.
Example: A Day in the Life Using Buildify
Imagine you are a project manager overseeing three active construction sites. You open Buildify in the morning and see a color-coded overview: one site is on track, another is slightly behind schedule, and the third has a budget variance that needs attention. You click into the budget overview to see which category is over budget—materials. You then reassign a team member from the on-track site to help the behind-schedule site. All of this happens within minutes, without switching between spreadsheets or email threads.
Getting Started with Buildify
To begin using the Buildify Management Dashboard, download the ZIP file and open the Figma file. The help guide walks you through the basics, including how to customize colors, fonts, and layout components. Because the layers are well-named and grouped, even beginners can make meaningful adjustments quickly.
The free Google Fonts included ensure that your final product looks professional without any font licensing issues. Whether you are prototyping a new product or building a production-ready dashboard, Buildify gives you a strong starting point.
Tips for Customization
- Start by adjusting the color scheme to match your brand while preserving the light purple-and-white foundation for readability.
- Replace placeholder data with your own project names, task lists, and budget figures to test real-world scenarios.
- Use the dark mode version for field teams who may work in low-light environments.
- Leverage the well-organized layers to add or remove components without breaking the overall layout.
Conclusion
The Buildify Management Dashboard is more than just a pretty UI—it is a practical, construction-focused tool designed to help teams manage projects more effectively. With features like progress trackers, task assignments, budget overviews, and workforce metrics, it addresses the key pain points of construction management. Its light purple-and-white theme, pixel-perfect layout, and light/dark mode support make it a versatile choice for prop-tech startups, field operations designers, and SaaS teams alike.
Whether you are building a new platform from scratch or looking to improve an existing one, understanding and customizing a dashboard like Buildify can save you time, reduce complexity, and help you deliver a better experience to your users. In a world where construction projects are only getting more complex, having the right dashboard makes all the difference.