Visora AI Data Visualization Dashboard: A Practical Guide to Building Smarter Analytics Workflows
Data visualization is no longer a nice-to-have in business intelligence or enterprise reporting—it is the primary interface between raw numbers and informed decisions. Yet many dashboards fall short because they prioritize aesthetics over clarity, or they lack the structural flexibility to adapt to different workflows. The Visora AI Data Visualization Dashboard addresses this gap by combining elegant layouts with advanced analytical UI components, all packaged in a format that is designed to be edited, customized, and integrated into real projects.
Whether you are building a monitoring system for internal teams, crafting a reporting tool for clients, or designing a business intelligence platform that needs to scale, understanding how to work with a template like this goes beyond just opening a Figma file. It involves planning how the dashboard fits into your broader process, how it interacts with other assets and tools, and how you can maintain consistency across light and dark modes, multiple screen sizes, and evolving data requirements.
What Visora AI Data Visualization Dashboard Is and Where It Belongs
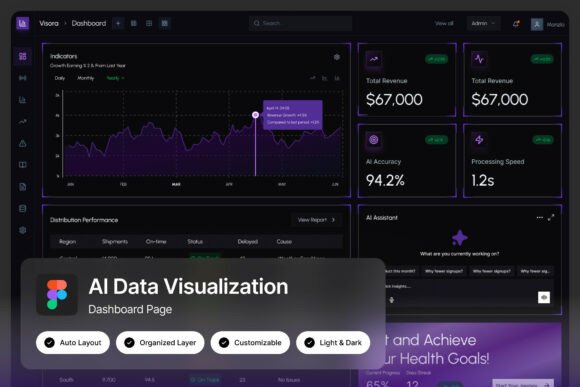
At its core, Visora is a high-quality landing page template built specifically for data-heavy interfaces. It provides two admin dashboard screens at a resolution of 1440×1024 pixels, with a pixel-perfect layout that is fully customizable. The template includes both light and dark mode interfaces, well-organized and named layers, and free Google Fonts integration. It is delivered as a Figma file, supported by a help guide and font links.
This template is not a one-size-fits-all component library. It is a starting point for anyone who needs to present data in a clean, professional, and actionable way. It fits naturally in the planning and design phase of a dashboard project, but its real value emerges when you treat it as a structural foundation rather than a final product. Because the layers are grouped and named logically, you can adapt the template to different datasets, branding guidelines, or user personas without rebuilding the entire layout from scratch.
Visora is especially useful for professionals who work across multiple tools and need a consistent visual language. If you are a product manager defining requirements for a new analytics module, a designer who needs to iterate rapidly on dashboard layouts, or a developer looking for a reference UI to translate into code, this template serves as a shared reference point that reduces friction between roles.
How Visora Fits Into Your Workflow Before, During, and After a Project
The best way to use a dashboard template is to think of it as part of a larger process, not as an isolated asset. Before you even open the Figma file, you should clarify what data the dashboard needs to display and who will use it. Visora supports this upfront planning by giving you a realistic canvas to sketch out information hierarchy. You can map your data sources to the available UI components—charts, tables, metrics cards, navigation elements—and identify gaps early.
During the active design phase, Visora accelerates your work because you are not starting from a blank page. The pixel-perfect layout and well-organized layers let you focus on fine-tuning visual details like typography, color contrast, and spacing rather than building grids and containers from scratch. The light and dark mode interface is particularly helpful here, as it forces you to consider how your data visualizations will look under different viewing conditions without doubling your workload.
After the dashboard is built and deployed, the template continues to add value as a documentation tool. Because the layers are named and grouped, you can use the Figma file as a source of truth for design specs, component states, and responsive behavior. This is invaluable when onboarding new team members or when revisiting the dashboard months later for updates. Instead of reverse-engineering your own design, you simply refer back to the organized file.
Key Design Features That Support Real-World Implementation
The Visora dashboard stands out because of several deliberate design decisions that align with practical workflows. The resolution of 1440×1024 pixels is a common baseline for admin dashboards viewed on laptops and desktop monitors. Designing at this resolution means you are optimizing for the most frequent use case while leaving room to adapt for larger screens or tablet views later.
The unique, stylish, and modern design language is not just about visual appeal. It helps reduce cognitive load for users who need to scan metrics quickly. By providing elegant visualization layouts and advanced analytical UI components, the template encourages you to think about data storytelling from the start. You are not just placing charts arbitrarily—you are following a structure that has been tested for readability and focus.
The inclusion of both light and dark mode is a workflow advantage that many templates overlook. Data dashboards are often used in environments where ambient lighting varies—open offices, late-night monitoring sessions, or client presentations. Having both modes ready to edit means you can offer users a choice without maintaining two separate design systems. This also simplifies front-end development, because the color tokens for each mode are already defined in the design file.
Integrating Visora Into Your Existing Tool Stack and Assets
Visora is delivered as a Figma file, which makes it compatible with one of the most widely used design platforms for UI and product work. Figma’s collaborative features let multiple team members work on the dashboard simultaneously, which is useful when a data analyst needs to review chart placements or a developer wants to inspect component measurements.
The free Google Fonts included in the template ensure that you are not locked into proprietary typefaces. This is a practical advantage for teams that need to comply with licensing policies or that want to maintain consistent typography across web and mobile properties. Because the fonts are well-known and widely supported, you can also export the design assets to other tools like Sketch, Adobe XD, or even directly into a front-end framework with minimal friction.
If you work with design systems, the well-organized and named layers make it straightforward to extract components like buttons, dropdowns, chart containers, and navigation bars. You can treat the Visora file as a component library that feeds into your larger design system, rather than as a standalone project. This reduces duplication and keeps your UI consistent across different products or client projects.
Practical Workflow Examples for Different Roles
For a business intelligence team that needs to build a client-facing monitoring dashboard, Visora provides a professional foundation. You can start by replacing the placeholder data with real metrics from your data warehouse, using the existing chart layouts as a guide. The pixel-perfect layout means you do not need to spend days adjusting margins and alignment—you can focus on data accuracy and visualization clarity.
For a product manager overseeing an analytics feature, the template can be used to create wireframes and prototypes that communicate the intended user flow. Because the layers are grouped logically, you can hide or rearrange sections to test different information hierarchies with stakeholders. This speeds up the feedback loop and reduces misunderstandings about what the final product should look like.
For a freelance designer or small business owner selling dashboard templates or reports, Visora can serve as a starting point for custom projects. You can rebrand the interface, adjust the color palette, and swap in new chart types to match a client’s industry. The included help guide and font links reduce the learning curve, so you can deliver results faster and with higher consistency across projects.
Implementation Tips for Smooth Adoption
Before you edit anything, take time to review the layer structure in Figma. Understanding how the file is organized will save you hours of searching later. The named groups are your map—use them to navigate between the light and dark mode versions, and make sure you are editing the correct instance for each screen.
When customizing the template, start with the color palette and typography before moving to data content. This ensures that your branding is applied consistently across all components. Because the template includes free Google Fonts, you can easily swap in your preferred typefaces without worrying about licensing restrictions.
If you plan to hand off the design to developers, use the pixel-perfect measurements and layer naming conventions to create a clear specification. Add notes to the Figma file for interactive states, hover effects, or responsive breakpoints. This minimizes back-and-forth and helps developers understand how the dashboard should behave, not just how it looks.
For long-term maintenance, keep the original Visora file as a master design system. When you need to add new dashboard screens or modify existing ones, duplicate the file and update only the sections that change. This preserves the original layout as a reference and prevents drift over time.
Long-Term Value and Quality Control Considerations
Templates like Visora deliver lasting value when you treat them as frameworks rather than one-time downloads. The well-organized layers and pixel-perfect layout support iterative refinement. As your data grows or as user needs evolve, you can revisit the design file and adjust the information hierarchy without starting over.
Quality control for data dashboards involves more than visual consistency. You also need to ensure that the data visualizations remain readable across different devices and screen sizes. While Visora is designed for 1440×1024 px, you can extend the layout to other resolutions by using Figma’s constraints and auto-layout features. The organized layer structure makes this adaptation process manageable.
Another aspect of long-term use is maintaining brand consistency. Because the template supports both light and dark modes, you can apply the same brand guidelines to both interfaces without extra effort. This is especially important for enterprise applications where different teams or clients may prefer different display modes.
Final Observations on Practical Use
The Visora AI Data Visualization Dashboard is not a magic solution that will automatically make your data insights clear. It is a well-crafted foundation that reduces the friction between having raw data and presenting it effectively. Its real power lies in how you integrate it into your existing workflow—how you prepare before opening the file, how you customize during the design process, and how you maintain consistency after launch.
By approaching this template with a clear understanding of your data sources, your audience, and your tool stack, you can turn a stylish design asset into a practical tool that supports better decisions. Whether you are building an internal monitoring system, a client-facing analytics portal, or a personal project that needs a professional interface, Visora gives you a head start without locking you into a rigid structure.
Focus on the process, keep your data clean, and let the template handle the visual foundation. That is where the real efficiency lies.