Adlytics AI Marketing Campaign Dashboard: A Practical Look at Modern Campaign Analytics
Marketing dashboards are everywhere, but few manage to balance visual clarity with genuine analytical depth. The Adlytics AI Marketing Campaign Dashboard attempts to fill that gap, offering a design system built specifically for performance marketers and growth-focused teams. After spending time with the files and evaluating how this UI kit holds up under realistic workflow conditions, several aspects stand out as worth discussing in detail.
What the Adlytics AI Marketing Campaign Dashboard Offers
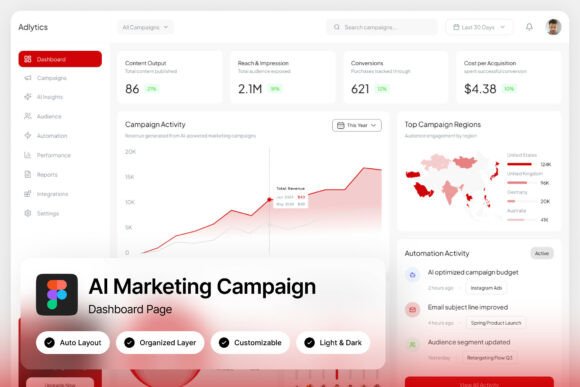
At its core, this is a Figma-based UI kit designed around a vibrant, data-rich analytics interface. The dashboard focuses on ad performance metrics, audience segmentation panels, ROAS (Return on Ad Spend) charts, and conversion funnels. The aesthetic is a modern green-and-dark theme that feels contemporary without being distracting. The resolution is set at 1440×1024 pixels, which aligns well with standard laptop and desktop displays used by most marketing professionals.
The kit includes two high-quality screens, a light and dark mode interface, and well-organized layers. You also get a help guide in PDF format and a text file with font links. Google Fonts are included, so licensing is straightforward. The package does not include stock imagery, which is worth noting if you plan to use it for client presentations that require polished visuals out of the box.
Layout and Information Hierarchy
One of the first things you notice is the pixel-perfect layout. The dashboard sections are clearly separated, and the grouping of layers is logical. If you have ever worked with a poorly organized Figma file, you know how much time can be wasted hunting for the right component. The Adlytics kit avoids that problem entirely. Layers are named and grouped in a way that makes sense for someone who needs to edit quickly under deadline pressure.
The information hierarchy also deserves mention. Key metrics like ROAS are placed prominently, while audience segmentation panels sit in secondary but still accessible positions. This structure mirrors how experienced marketers actually consume data: top-level KPIs first, then deeper demographic and behavioral insights. It is a layout that respects user intent rather than forcing a rigid narrative.
Color and Readability
The green-and-dark scheme is not just visually appealing; it also serves a functional purpose. High-contrast elements make numbers and chart data easy to scan at a glance. For anyone who monitors campaigns across multiple ad platforms simultaneously, reducing cognitive load is a genuine advantage. The dark mode option further supports extended screen time, which is common in performance marketing roles.
That said, the green accent color may not suit every brand identity. If your team or client prefers a different primary color, you will need to adjust the palette manually. The layers are well-organized, so this is manageable, but it is not a one-click change.
For Performance Marketers and Growth Teams
The dashboard is clearly tailored for professionals who live inside ad platforms like Google Ads, Meta Ads Manager, or programmatic buying tools. The inclusion of conversion funnels and audience segmentation panels reflects the real needs of media buyers who must optimize across multiple stages of the customer journey. Rather than just displaying vanity metrics, the layout encourages attention to actionable data points such as cost per acquisition and funnel drop-off rates.
In a typical weekly campaign review, a performance marketer might use the dashboard to present ROAS trends alongside demographic performance. The side-by-side arrangement of these elements in the kit supports that workflow naturally. It reduces the time spent rearranging data before a client or internal review meeting.
For Agencies Building Client Reports
Digital marketing agencies often need to present data in a way that is both detailed and digestible. The Adlytics dashboard kit provides a strong foundation for that. The clean layout and modern aesthetic help agencies look polished without investing hours in custom design work. The light and dark mode options also allow flexibility depending on whether the report will be presented on a screen or printed.
One limitation here is that the kit includes only two screens. For agencies managing more complex reporting structures, additional screens may be needed to cover different campaign types or client verticals. However, the well-organized layers make it feasible to extend the design without starting from scratch.
For SaaS Designers and Product Teams
If you are building a campaign tracking or media buying platform, this kit can serve as a solid starting point for your UI. The pixel-perfect layout and logical component grouping reduce the gap between wireframes and final design. The inclusion of both light and dark interfaces is also valuable for product teams that need to support user preferences.
The real test for product use is how easily the design translates into development. Because the kit uses Google Fonts and standard resolution, it aligns well with common front-end frameworks. Developers should be able to extract measurements, spacing, and component behavior without excessive back-and-forth with the design team.
Ease of Editing
The kit is fully customizable, and the file structure supports that claim. Layers are named descriptively, and groups are organized by function. Whether you need to adjust chart colors, swap out placeholder data, or modify spacing, the process is straightforward. The accompanying PDF guide provides basic orientation, though experienced Figma users will likely find the file intuitive enough to navigate without it.
For teams new to Figma, the learning curve is minimal. The kit does not rely on advanced plugins or complex auto-layout configurations that could confuse beginners. It is a clean, traditional design file that behaves predictably.
What Is Not Included
The images shown in the preview are for demonstration only and are not part of the download. If you plan to use the dashboard for a client presentation or a live prototype, you will need to source your own data visualizations and imagery. This is standard for UI kits, but it is worth factoring into your timeline and budget.
Additionally, the kit does not include interactive prototypes or animation. It is a static design system. If your workflow relies on demonstrating user interactions or data transitions, you will need to add those elements yourself.
Reusability Across Projects
One measure of a UI kit's value is how often you can reuse it. The Adlytics dashboard is versatile enough to apply across different campaigns, clients, or products. The core layout—ad performance metrics, segmentation, ROAS, and funnels—is relevant to most performance marketing contexts. Once you have customized the palette and fonts to match a brand, you can save that version as a template for future work.
For freelancers and small agencies, this reusability translates directly into time savings. Instead of rebuilding a dashboard for each new client, you can adapt an existing file and focus on the unique data story.
Consistency Across Screens
The two screens included in the kit maintain strong visual consistency. Spacing, typography, and color usage are uniform, which is essential for professional presentation. If you expand the kit with additional screens, the existing design language gives you clear guidelines to follow. This consistency also helps teams that collaborate on the same file, as everyone works from the same visual standards.
Who Will Benefit Most from This Dashboard Kit
Based on the design choices and included features, the ideal users are:
- Performance marketers who need a clear, data-focused interface for daily campaign monitoring and optimization.
- Digital marketing agencies that want to present client data in a modern, professional format without excessive design overhead.
- SaaS designers and product teams building ad tracking or media buying platforms who need a strong UI starting point.
- Freelancers and small business owners managing their own ad spend who want a better view of campaign performance than typical platform dashboards provide.
- Serious hobbyists and bloggers who run their own promotions and need a straightforward way to visualize ROAS and audience data.
For larger enterprises with dedicated data visualization teams, the kit may feel limited in scope. However, even in those environments, it can serve as a rapid prototyping tool or a reference for internal design standards.
Practical Recommendations for Getting the Most Out of It
If you decide to use the Adlytics AI Marketing Campaign Dashboard, here are a few recommendations based on common workflows:
- Start with the dark mode version if your team spends long hours reviewing data. Eye strain is a real productivity issue, and the dark interface helps mitigate that.
- Customize the color palette early to match your brand or client identity. Doing this before building out multiple screens saves rework later.
- Use the layer naming conventions as a foundation for your own file organization. The kit sets a good example, and maintaining that structure will pay off as your project grows.
- Source your own chart data from real campaign platforms to test how the dashboard handles dense information. Placeholder data never reveals edge cases like long campaign names or extreme metric values.
- Consider creating a third screen for campaign-level comparisons if you manage multiple ad accounts simultaneously. The existing screens focus on individual performance, and a comparison view would round out the toolkit.
Possible Limitations Worth Acknowledging
No resource is perfect for every scenario, and the Adlytics dashboard has a few limitations that honest evaluation should note. The two-screen count may feel restrictive for complex reporting needs. The static nature of the file means you will need to invest time if you want interactive prototypes. And the green-and-dark palette, while modern, may not align with every brand's visual identity without modification.
None of these are dealbreakers, but they are worth considering before purchase. If your project requires a dozen distinct dashboard views or real-time data connectivity, this kit will be one piece of a larger solution rather than a complete answer.
Final Thoughts on the Adlytics AI Marketing Campaign Dashboard
For performance marketers, agencies, and product teams who need a polished, data-oriented dashboard UI without starting from a blank canvas, this kit offers genuine practical value. The layout is thoughtful, the design is modern, and the file organization respects the user's time. It fills a specific niche well: providing a professional foundation for campaign analytics that can be adapted to different contexts with reasonable effort.
The kit will serve you best if you already understand what metrics matter for your campaigns and simply need a clean, consistent way to display them. It is not a magic solution that replaces analytical thinking, but it is a solid tool that supports it. For anyone working in ad tech, digital marketing, or product design for campaign platforms, it is worth a close look.