Transacta Payments Dashboard: A Modern Approach to Transaction Monitoring and Financial Data Visualization
In the fast-paced world of digital finance, the ability to monitor transactions, track revenue, and visualize payment trends in real time is no longer a luxury—it is a necessity. Whether you are a payment gateway team managing thousands of transactions per minute, a financial product designer refining user experience, or a developer building robust transaction monitoring tools, the dashboard you use can make or break your workflow. Enter Transacta Payments Dashboard, a clean, light-themed payments management UI that combines elegance with functionality. This article explores everything you need to know about this professional SaaS dashboard, from its core features to its practical applications in modern fintech environments.
What Is the Transacta Payments Dashboard?
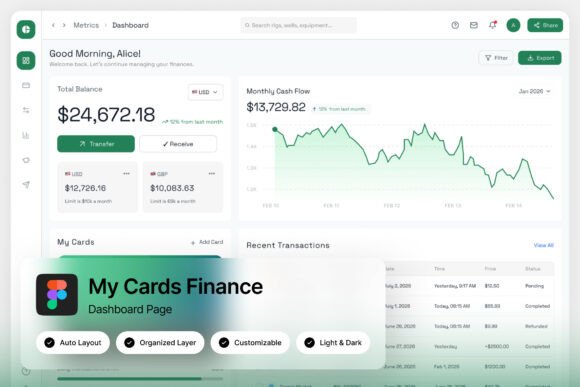
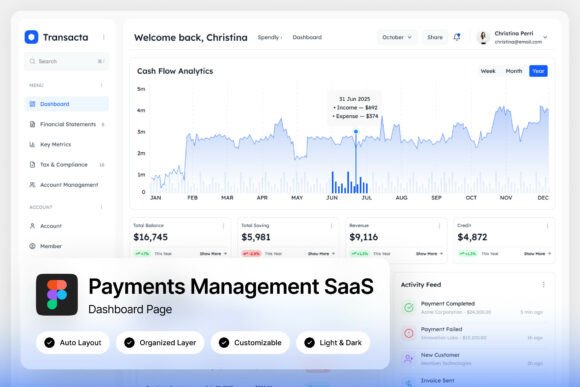
The Transacta Payments Dashboard is a meticulously designed user interface built specifically for payment management and financial data oversight. It presents transaction logs, revenue summaries, payment status cards, and trend line charts in a crisp blue-and-white layout. The design follows a professional SaaS aesthetic, making it an ideal fit for fintech platforms, neobanks, payment processors, and any business that relies on real-time payment tracking.
Delivered as a Figma file along with a help guide and font links, the dashboard is fully customizable. It offers both light and dark mode interfaces, pixel-perfect layout, and well-organized, named, and grouped layers. The resolution is set at 1440×1024 pixels, ensuring a high-quality display on standard desktop screens. The product is not just a visual asset—it is a tool for thinking about how financial data should be presented to users who need clarity, speed, and accuracy.
Why a Dedicated Payments Dashboard Matters
In the broader landscape of financial technology, data is abundant, but insight is rare. A payments dashboard serves as the central nervous system for any organization that processes transactions. Without a clear, organized, and interactive interface, teams risk missing critical information—such as failed payments, revenue dips, or emerging trends—that could affect business decisions.
The purpose of a dashboard like Transacta is to transform raw transaction data into actionable intelligence. It helps answer questions like:
- How many transactions succeeded in the last hour?
- What is the total revenue for the current week compared to last week?
- Which payment methods are failing most frequently?
- Are there any unusual spikes or drops in payment activity?
By providing at-a-glance answers to these questions, a well-designed dashboard empowers teams to act quickly, reduce friction, and optimize the payment experience for end users.
Core Components of the Transacta Dashboard
Understanding what makes up a payments dashboard helps you appreciate its design and utility. Transacta includes several key components that are common in professional fintech UIs but are executed with a unique, modern flair.
Transaction Logs
Transaction logs are the backbone of any payment monitoring system. Transacta presents these logs in a clean, sortable table format. Each entry typically includes details such as transaction ID, date and time, payment method, amount, status, and customer information. The light-themed background with subtle dividers ensures readability even when scrolling through hundreds of rows. For teams managing high-volume flows, this clarity reduces cognitive load and speeds up error detection.
Revenue Summaries
Revenue summaries provide a high-level view of financial performance. Transacta displays these as compact cards or summary bars, showing metrics like total revenue, average transaction value, and revenue growth percentage. The blue-and-white color scheme is intentionally calm, helping users focus on numbers without visual distraction. These summaries are often the first thing a manager or stakeholder looks at when opening the dashboard.
Payment Status Cards
Payment status cards offer a quick visual breakdown of transaction outcomes—successful, pending, failed, or refunded. Transacta uses small, color-coded cards with icons and counts. This design allows users to spot anomalies immediately. For example, a sudden increase in failed payments can be flagged and investigated before it impacts customer satisfaction.
Trend Line Charts
Trend line charts are essential for understanding payment behavior over time. Transacta includes these charts to show metrics like daily transaction volume or revenue trends. The lines are crisp, the axes are labeled clearly, and the overall look is minimal yet informative. This feature is particularly valuable for financial analysts and product teams who need to identify patterns, seasonality, or the impact of new features on payment behavior.
Who Benefits from Using Transacta?
The Transacta Payments Dashboard is built for a range of professionals, each of whom interacts with the dashboard in a slightly different way.
- Payment gateway teams rely on real-time transaction logs and status cards to monitor system health and respond to issues quickly.
- Financial product designers use the dashboard as a reference for building intuitive, user-friendly interfaces that balance data density with visual clarity.
- Developers working on transaction monitoring tools can leverage the well-organized Figma layers to implement consistent UI components across their applications.
- Business analysts and finance managers benefit from the revenue summaries and trend charts to track performance and forecast future growth.
In short, anyone who needs to understand payment data at a glance will find Transacta a valuable asset.
Design Philosophy: Clean, Light, and Professional
One of the standout qualities of Transacta is its design philosophy. The light theme with blue accents is not arbitrary—it is rooted in best practices for data visualization. Light backgrounds reduce glare and eye strain over long work sessions, while blue is associated with trust, stability, and clarity—qualities that are essential in financial contexts.
The layout follows a pixel-perfect grid, ensuring alignment and spacing are consistent across all components. Layers are well-named and grouped, which makes customization straightforward. Whether you want to adjust colors, swap fonts, or rearrange modules, the file structure supports efficient editing.
The inclusion of both light and dark modes is another thoughtful touch. Dark mode is increasingly popular among developers and night-shift workers, and offering both options ensures the dashboard remains usable in any environment.
Practical Applications in Modern Business
To understand the practical relevance of Transacta, consider a few real-world scenarios.
Scenario 1: A growing e-commerce platform processes thousands of payments daily. The finance team uses the revenue summary cards to track daily sales and compare them against targets. When a payment gateway integration fails, the transaction logs show a spike in failed payments within minutes, allowing the engineering team to switch to a backup provider before customers notice.
Scenario 2: A fintech startup is designing its own payment monitoring tool. The product designer uses Transacta as a reference for layout, color scheme, and component placement. The well-organized Figma layers make it easy to adapt the design to the startup's brand guidelines, saving weeks of design work.
Scenario 3: A financial analyst at a payment processor reviews trend line charts weekly to identify seasonal patterns. The clear visualization helps them prepare reports for stakeholders, showing how transaction volumes correlate with marketing campaigns or holiday seasons.
These examples illustrate how a thoughtfully designed dashboard can improve operational efficiency, reduce errors, and support strategic decision-making.
Common Misunderstandings About Payment Dashboards
Some people assume that a payment dashboard is only useful for large enterprises with dedicated finance teams. In reality, even small businesses and solo entrepreneurs can benefit from having a clear view of their transaction data. A dashboard like Transacta scales with your needs—you can start with basic metrics and add complexity as your business grows.
Another misconception is that dashboards are purely operational tools. While they are excellent for day-to-day monitoring, they also serve strategic purposes. Trend charts and revenue summaries help businesses identify growth opportunities, optimize pricing, and understand customer behavior over time.
Finally, some believe that all dashboards are essentially the same. In practice, the difference lies in the details: how data is grouped, how colors are used, how quickly the eye can find what matters. Transacta's attention to these details sets it apart from generic templates.
What You Get and How to Use It
When you download Transacta, you receive a Figma file (.fig), a help guide (.pdf), and a font links (.txt) file. The Figma file contains the full dashboard design with all layers named and grouped. The help guide walks you through the structure and offers tips for customization. The font links file provides access to the free Google Fonts used in the design.
Images shown in previews are for demonstration only and are not included in the download. This is standard practice for UI asset packs, as the focus is on the editable design itself rather than placeholder imagery.
To get started, open the Figma file, browse the layers panel to understand the component hierarchy, and begin customizing colors, text, or layout to match your brand. The pixel-perfect layout ensures that your final product will look polished and professional.
Final Thoughts: Why Transacta Stands Out
The Transacta Payments Dashboard is more than a collection of UI elements—it is a thoughtful representation of how payment data should be presented. Its clean, light-themed design, combined with powerful features like transaction logs, revenue summaries, payment status cards, and trend line charts, makes it suitable for a wide range of fintech applications.
Whether you are building a new payment monitoring tool, refining an existing product, or simply looking for design inspiration, Transacta offers a solid foundation. Its professional aesthetic, ease of customization, and attention to user experience make it a valuable resource for payment gateway teams, product designers, and developers alike.
In a world where financial data grows more complex every day, having a dashboard that simplifies without sacrificing depth is not just nice to have—it is essential. Transacta delivers exactly that.