Using the Insight Flow AI Web Analytics Dashboard to Streamline Your Data Strategy
Data-driven decision-making has become a core requirement for anyone managing a website, digital campaign, or online business. Yet the gap between raw data and actionable insight remains wide. You can pull reports from multiple platforms, export spreadsheets, and stare at graphs, but without a clear framework for interpretation, the numbers stay just numbers. The Insight Flow AI Web Analytics Dashboard addresses this by offering a structured, visual environment where metrics become meaningful patterns. This article walks through how this dashboard fits into real workflows, how to prepare for implementation, and what to expect when integrating it into your existing toolkit.
What the Insight Flow AI Web Analytics Dashboard Brings to Your Workflow
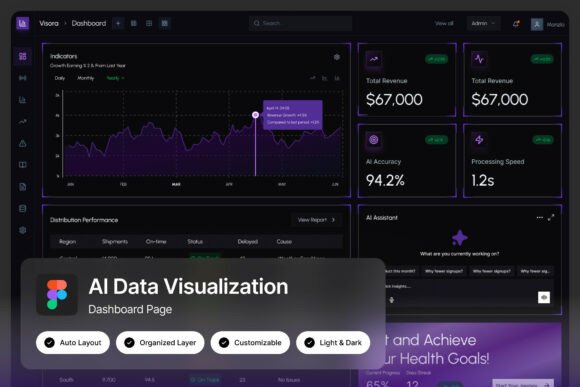
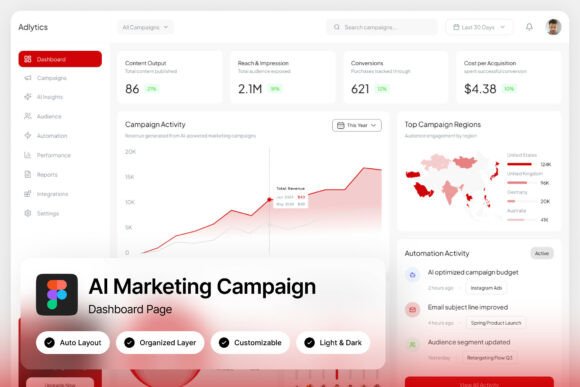
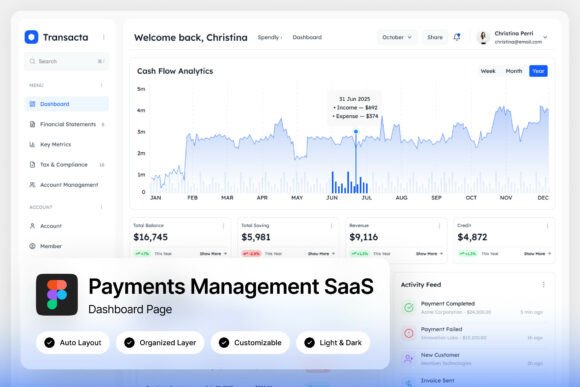
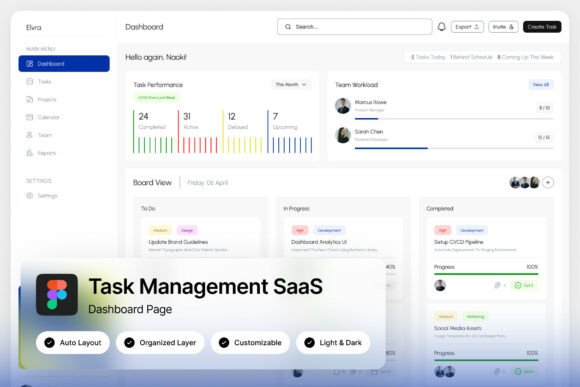
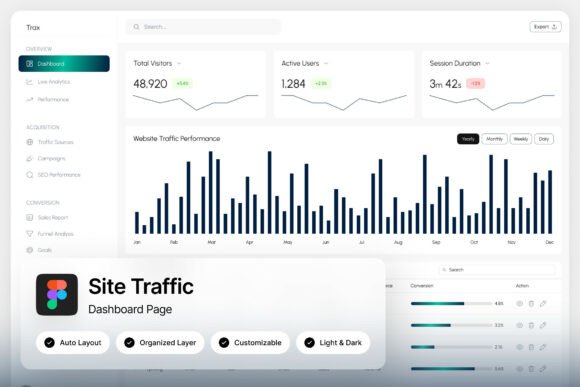
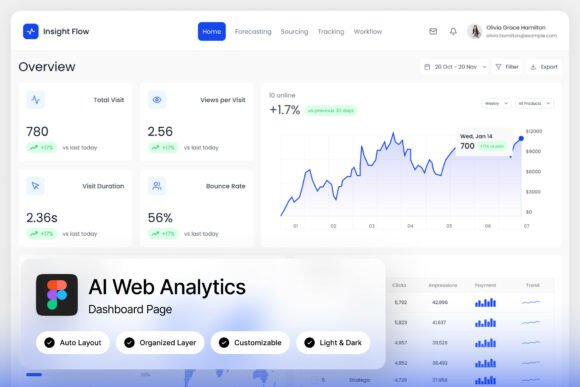
At its core, this dashboard is a Figma-based template designed for digital marketing platforms, website tracking systems, SEO analytics tools, and online business intelligence services. It provides two high-quality admin dashboard screens at 1440×1024 px resolution, available in both light and dark modes. The layout is pixel-perfect, with well-organized layers and grouped components that make customization straightforward. The template uses free Google Fonts, and the download includes a .fig file, a help guide PDF, and a font links text file.
What makes this template stand out is its focus on analytical clarity. Instead of forcing you to build dashboard wireframes from scratch, it gives you a clean foundation for visualizing KPIs, traffic sources, user behavior, conversion data, and SEO performance. The intelligent visualization elements help stakeholders grasp trends quickly, which matters when you need to communicate insights to a team or client without drowning them in raw numbers.
Where It Fits in a Broader Process
Think of this dashboard as a planning and presentation layer that sits between your data sources and your final business decisions. It does not replace Google Analytics, your CRM, or your SEO toolset. Instead, it serves as a visual translator. You pull data from your existing platforms and map it onto the dashboard layout to create a unified view. This makes it useful at multiple stages:
- Before a project: Use it to define which metrics matter most. Laying out the dashboard forces you to clarify your goals, whether you are launching a campaign, redesigning a site, or starting a content strategy.
- During execution: Monitor live or weekly data by populating the dashboard with real figures. The clean layout helps you spot anomalies or trends without sifting through cluttered reports.
- After completion: Present post-project performance in a format that stakeholders can digest quickly. The dark and light modes give you flexibility for different presentation contexts.
Preparing for Effective Dashboard Implementation
Before you open the Figma file, take a moment to define your data sources and the questions you want the dashboard to answer. This preparation step saves hours of rework later. Start with three questions:
- Who is the audience? A dashboard for internal team review looks different from one shared with a client or executive. The Insight Flow AI template supports both contexts, but your choice of metrics and visual emphasis should reflect who will view it.
- What data feeds are available? List your platforms—Google Analytics, Search Console, social media insights, CRM exports, ad platforms. The dashboard can display data from any source, but you need to know how often data refreshes and whether you have API access or manual export capability.
- Which metrics matter most? Resist the urge to put every available number on the screen. A focused dashboard showing five to seven key indicators is more useful than a crowded one. The template’s layout naturally encourages prioritization.
Tool Compatibility and Integration
The Insight Flow AI Web Analytics Dashboard is a Figma file, which means you need a Figma account (free or professional) to open and customize it. If you already use Figma for UI design, wireframing, or collaborative design reviews, you are already familiar with the environment. If you are new to Figma, the included help guide PDF walks you through basics like editing text, swapping colors, and rearranging layers.
The template works well alongside other planning tools. You might export screenshots or PDFs to embed in Google Slides, Keynote, or Notion presentations. You can also use it as a reference when briefing developers or data engineers who build live dashboards in tools like Tableau, Power BI, or Looker Studio. The value here is in the design language and layout logic, not in live data binding.
Practical Workflow Examples
Seeing how others use the template can clarify how it fits into your own routine. Here are three scenarios that reflect common use cases among marketers, entrepreneurs, and small business owners.
Scenario One: Monthly SEO Performance Review
A content marketing manager tracks organic traffic, keyword rankings, backlink growth, and conversion rates. Instead of compiling a text-heavy report each month, they open the Insight Flow AI dashboard in Figma and populate the predefined sections with the latest data. The dark mode version works well for on-screen review during team meetings. The manager highlights trends with annotations directly in Figma, then exports a static image for the final report. Over time, they reuse the same layout, only updating numbers and notes. This reduces report creation time by about 40 percent while improving visual consistency.
Scenario Two: Campaign Performance Dashboard for Clients
A freelance digital marketer manages paid ad campaigns for several small businesses. Each client wants a clear picture of spend, impressions, clicks, and conversions. The marketer creates a master dashboard in the template, then duplicates the file for each client. Light mode works better for printed reports or PDF attachments. The grouped layers make it easy to swap out logos and brand colors. Clients appreciate not having to navigate complex ad platform interfaces to understand their results.
Scenario Three: Internal Business Intelligence Snapshot
A startup founder tracks monthly recurring revenue, user acquisition cost, active users, and churn rate. They use the Insight Flow AI dashboard to create a one-page snapshot for the advisory board. The clean layout removes distractions and focuses attention on the numbers that drive fundraising conversations. Because the template supports both light and dark modes, the founder can switch to dark mode for projector presentations and light mode for printed handouts.
Customization Tips for a Smooth Editing Process
The template is fully customizable, but a few practices will keep your edits efficient and your file organized.
- Work with components: Figma’s component system allows you to edit one element and have changes apply across all instances. The template already uses grouped layers. When you change a color style or font, use Figma’s text and color styles panel to maintain consistency.
- Use the help guide: The included PDF covers basics like duplicating screens, adjusting chart elements, and exporting assets. Read it once before starting edits to avoid trial-and-error.
- Keep the original file intact: Duplicate the .fig file before making heavy modifications. This gives you a fallback if you want to revert or reuse the original layout for another project.
- Mind the resolution: The dashboard is built at 1440×1024 px. If you need other dimensions, resize with care. Use Figma’s constraints and auto layout features to maintain spacing and alignment.
Efficiency Gains from Organized Layers
The template’s well-named and grouped layers save significant time. When you need to adjust a chart, you do not hunt through dozens of unnamed frames. You expand the “Charts” group and find exactly what you need. This organization also helps if you collaborate with others in Figma. Team members can open the file and understand the structure immediately, reducing onboarding friction.
Maintaining Quality and Consistency Over the Long Term
A dashboard template is only as good as the discipline you bring to updating it. Set a regular cadence for refreshing data—weekly, monthly, or per campaign cycle. If you use the same layout repeatedly, create a master file with placeholder data and duplicate it for each new period. This ensures that your visual framework stays consistent while the underlying numbers change.
Over time, you may want to evolve the layout. The Insight Flow AI template gives you a strong starting point, but your needs will shift. Maybe you add a new metric, remove one that no longer matters, or adjust the color palette to match a brand refresh. Because the layers are well-organized, these changes take minutes rather than hours. The same goes for switching between light and dark modes. The template includes both, so you can toggle without rebuilding anything.
When to Redesign vs. When to Reuse
Resist the temptation to redesign the dashboard every quarter. The value of a consistent layout is that stakeholders learn where to look. If you keep moving elements, you undermine the very clarity the dashboard is meant to provide. Keep the structural layout stable and only update data and minor visual details. Reserve redesigns for major shifts in business strategy or when the template no longer supports the metrics you need to track.
Final Observations on Integrating the Dashboard into Your Routine
The Insight Flow AI Web Analytics Dashboard is not a magic solution that automatically processes data. It is a design asset that helps you present data with intention. Its real power emerges when you pair it with a clear understanding of your audience, your metrics, and your reporting rhythm. Whether you are a blogger tracking page views, an agency owner reporting to clients, or a product manager monitoring user engagement, this template gives you a professional foundation without requiring design expertise.
Take the time to prepare your data sources before opening the file. Define your KPIs. Decide who will see the dashboard and how often you will update it. Then use the template’s clean layout, dark and light modes, and organized layers to build a tool that saves you time and communicates clearly. The download includes everything you need to get started: the Figma file, a help guide, and font links. The images shown in previews are for illustration only, but the structure they demonstrate is ready for your real data.
In a world where every digital business competes for attention, clear data presentation is not a luxury. It is a practical advantage. The Insight Flow AI Web Analytics Dashboard helps you turn that advantage into a repeatable process.